
TAM SAM SOM: A Founder's Guide to Market Sizing
TAM, SAM, and SOM explained for founders: what each metric means, how to calculate them top-down and bottom-up, real examples, and mistakes to avoid.
tam sam som
TAM, SAM, and SOM are the three market sizing metrics every early-stage founder needs before pitching investors or writing a business plan. They are not interchangeable, and getting them wrong is one of the fastest ways to lose credibility in a pitch room.
Here is what each one means:
- TAM (Total Addressable Market): The total revenue opportunity if your product captured 100% of the market with zero competitive or geographic constraints. Think of it as a theoretical ceiling, not a target.
- SAM (Serviceable Available Market): The slice of TAM your business can realistically serve, constrained by geography, distribution, customer segment, and product capacity.
- SOM (Serviceable Obtainable Market): The portion of SAM you can realistically capture within 3–5 years, given your current budget, team, and competitive position. This is the number that drives your near-term revenue projections.
Investors care about all three, but they scrutinize SOM hardest. A $10 billion TAM impresses no one if your SOM is vague. Carta notes that a good VC thumb rule is a TAM exceeding $1 billion as a signal of venture scale, but your SOM is what actually drives investment decisions.
How to calculate TAM, SAM, and SOM step by step
Two methods dominate market sizing: top-down and bottom-up. Neither works alone. The strongest models use both and cross-check the results.

Top-down approach
Start with a macro figure from an industry report (Gartner, Forrester, or a federal dataset), then apply filters to narrow it down.
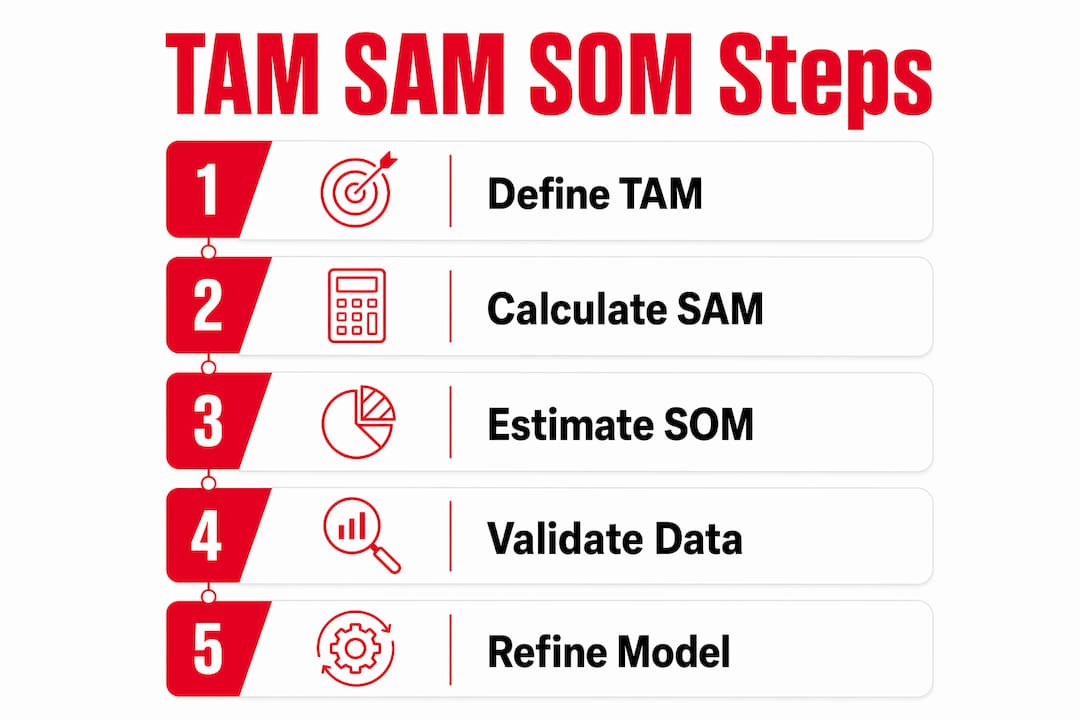
- Step 1: Find total industry revenue for your category using Census Bureau County Business Patterns (CBP) or a named analyst report.
- Step 2: Apply geographic, demographic, or product filters to isolate your SAM.
- Step 3: Estimate the percentage of SAM you can capture with your current resources to arrive at SOM.
This method is fast, but it relies on assumptions. Always document every filter you apply.
Bottom-up approach
Bottom-up market sizing starts with real customer data and scales outward. It is harder to build but far more credible with investors.
- Step 1: Count the customers you can realistically serve (SOM), based on your sales capacity and conversion data.
- Step 2: Expand that to the full addressable segment your model can reach (SAM).
- Step 3: Scale to the total market opportunity (TAM) using industry-wide data.
Pro Tip: Cross-validate your top-down TAM against a bottom-up build. If the two figures diverge wildly, your assumptions need work before you walk into a pitch.
Market segmentation analysis must happen before either calculation. Segmenting by demographic, geographic, and behavioral criteria, as outlined in OpenStax's Introduction to Business, sharpens your SAM and prevents you from building a model on an audience that does not exist for your product.
Common mistakes founders make when sizing their market
Most founders overestimate their SOM. It is the single most common credibility killer in early-stage pitches, and it usually comes from skipping the bottom-up build entirely.

Mistake 1: Relying only on top-down estimates. Taking a $50 billion industry figure and claiming 1% of it as your SOM is not a model. It is a guess. Carta and VantaInsights both stress that bottom-up validation is what separates credible founders from wishful thinkers.
Mistake 2: Skipping market segmentation. Broad, unsegmented TAM figures produce inaccurate SAM and SOM numbers. Segment first by geography, customer size, or buying behavior before running any numbers. Skipping this step leads to wasted marketing spend and a model investors will pick apart.
Mistake 3: Using static numbers. Market sizing is not a one-time exercise. Founders who refresh their metrics with real performance data, including customer acquisition cost (CAC) and conversion rates, build models that hold up over time.
Mistake 4: Ignoring competitive density. Your SOM is not just a function of market size. It reflects your competitive position. A fragmented market with low barriers gives you more room; a concentrated one shrinks your realistic capture rate fast.
Pro Tip: Use interquartile ranges from industry benchmarks rather than single-point estimates for conversion and revenue figures. Ranges reflect real-world variability and signal to investors that you understand market uncertainty.
Real startup examples that show TAM, SAM, and SOM in action
Abstract definitions only go so far. Here is how the framework plays out across three different startup types.
Auto mechanic business (service, local)
A Queens-based mechanic specializes in new Ford models. According to TechTarget's TAM SAM SOM breakdown, Ford sells approximately 14 million new models per year in the U.S., making that the TAM for mechanics targeting first-year Ford owners. The SAM narrows to 75,000 new Ford models sold in New York City. The mechanic serviced 150 of those, producing a SOM of 0.2% of the New York City market.
SaaS company (bottom-up build)
A project management SaaS targeting U.S. manufacturers uses a bottom-up approach:
- TAM: Roughly 600,000 U.S. manufacturing businesses × $10,000 average annual revenue per customer = $6 billion.
- SAM: 200,000 manufacturers with 50–100 employees (the product's best fit) × $10,000 = $2 billion.
- SOM: Sales capacity to close 1,000 new customers per year × $10,000 = $10 million.
Eco-friendly retail brand (top-down build)
- TAM: The U.S. eco-friendly beauty industry is worth $6.5 billion.
- SAM: 46% of beauty shoppers prefer buying in physical stores, so SAM = $2.99 billion.
- SOM: Launching in Los Angeles (roughly 1% of the U.S. population), then capturing 10% of that local market = $2.99 million.
Each example shows the same logic: start broad, apply real filters, and tie SOM to something you can actually execute. The Grillr Masterplan walks through this structure for your own model.
How to validate your market size estimates with real data
A number without a source is an opinion. Investors know the difference, and so should you.
The most defensible U.S. market data comes from federal sources. Census Bureau County Business Patterns provides establishment counts and payroll by NAICS code at the national, state, and county level. BLS Quarterly Census of Employment and Wages adds employment data by industry. These sources are free, methodologically transparent, and updated regularly, making them more credible than expensive proprietary reports.
HG Insights offers AI-driven market opportunity mapping trusted by a large share of Fortune 500 tech companies, and it is worth knowing as a reference point for technology market sizing. Creatio, recognized as a leader in Gartner's Magic Quadrant for B2B Marketing Automation, provides CRM tools that help growing teams track the customer data that feeds bottom-up models.
Run your SOM through a basic resource check: does your sales team have the capacity to close the number of accounts you projected? Does your marketing budget support the customer acquisition cost implied by your conversion rate? If the answer to either is no, your SOM needs to come down before you pitch.
Limitations of TAM, SAM, and SOM analysis
The framework is useful, but it has real constraints every founder should understand before presenting numbers to investors.
Data quality varies. Federal datasets are reliable but lag by months or years. Industry reports are current but expensive and sometimes methodologically opaque. Neither source perfectly captures a brand-new market category.
The framework assumes a static market. TAM, SAM, and SOM calculations reflect a moment in time. A competitor entering your SAM, a regulatory change, or a shift in consumer behavior can make last quarter's model obsolete. Build in a review cadence, not just a one-time calculation.
SOM is the hardest number to get right. It depends on assumptions about your sales velocity, conversion rates, and competitive win rates, none of which a pre-revenue startup can know with certainty. Founders who overestimate their SOM without tying it to actual resources lose investor trust quickly.
The framework does not replace strategy. Knowing your TAM, SAM, and SOM tells you the size of the opportunity. It does not tell you how to win it. Pair your market sizing with a clear go-to-market plan, or the numbers float without context.
Grillr stress-tests your market before investors do

Grillr is built for exactly this stage. It interrogates your business idea with targeted questions, runs market validation using real-source research, and grades your outputs with PASS or FAIL feedback so you know where you stand before you walk into a pitch. No vague advice. No generic templates.
If your market sizing needs pressure-testing, validate your startup idea with Grillr and find out what holds up and what does not.
Key takeaways
- SOM drives investor decisions: tie it to real sales capacity and budget, not a percentage of TAM.
- Bottom-up beats top-down alone: cross-validate both builds; diverging figures signal weak assumptions.
- Segment before you calculate: unsegmented TAM figures produce inaccurate SAM and SOM estimates.
- Use federal data sources: Census Bureau CBP and BLS datasets are free, transparent, and defensible.
- Market sizing is not static: refresh the numbers with real CAC and conversion data as you grow.
Done reading? Stop planning and start building.
Start building